It seems that it is meant to be - that my experiences with CDNs will be out of ordinary (Or is this the new normal?).

After all, I have worked with 3 major providers in past 2 years, and have been left wanting. Some of these I have blogged about before, and others just ignored.
The missing stylesheets
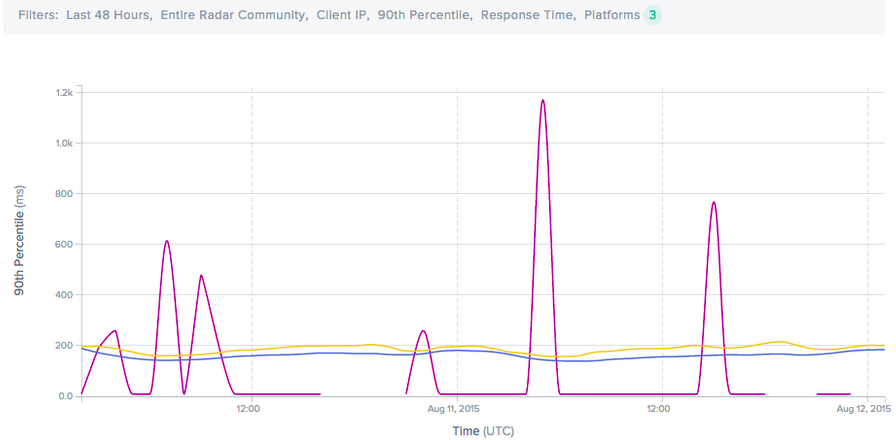
Repeatedly hearing people complain about slow image loading is not fun. Not being able to reproduce the issues consistently doesn’t help either. But we kept getting this - and most recently, in our very own office, I was shown a case where loading an static css asset took 26.4 seconds and timed out. When that happened, the site looks no different from the emperor who had no clothes. But how to tell that to your CDN provider?
In the past - we tried using third party CDN monitors like cedexis, and it indeed exposed some problems.
The problem with a third party like CDS was, we didn’t know the exact methodology. And like the swindlers in Andersen’s tales, such advisors can be dismissed as ‘incompetent’.
So this is what the problem statement boiled to - can we measure ourselves (and thus prove) the extent of this problem.We did figure out an easy way to do that, without requiring to do any code changes, and since we didn’t find any prior art on this, I will explain this for the benefit of other victims.
The idea was simple - how about measuring using javascript if the CSS has been loaded or not, and then collecting stats on how many times this happens?
My first thought was to use document.styleSheets to identify if the CSS has been loaded. While this worked in theory, for cross domain objects, there is no way to tell, or at least none I could find. And if your css is coming from a CDN, its bound to be cross domain. Bummer
The second idea was to identify a tag that has some associated css property that you set in your assets file. For example, we give a distinctly gray color to our h1 headings, which are black by default. This sure was an interesting property, one that can be measured. The method to our rescue was getComputedStyle, and here is how we did it.
-
Created a new tag in GTM, and a trigger to fire it on Homepage (once per page).
-
In that tag, compute the style of an element that is customized via CSS, and check for a property you change. If there is an issue with loading images, the CSS will fail to run, and the modified property will default to its natural value.
-
If the property is indeed unchanged, fire a ga exception to get the data in GA.
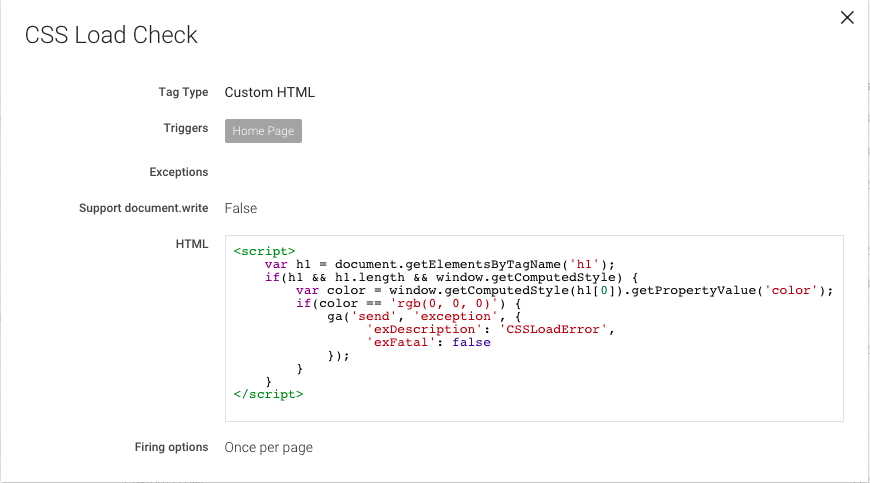
In case you want to copy - here is the snippet again
<script>
    var h1 = document.getElementsByTagName('h1');
    if(h1 && h1.length && window.getComputedStyle) {
        var color = window.getComputedStyle(h1[0]).getPropertyValue('color');
        if(color == 'rgb(0, 0, 0)') {
            ga('send', 'exception', {
                 'exDescription': 'CSSLoadError',
                 'exFatal': false
            });
        }
    }
</script>
That was it - except that I had some trouble finding where exactly the exceptions are shown. Apparently the exception report is never shown, and you need to create a new report in Customizations to see that data.
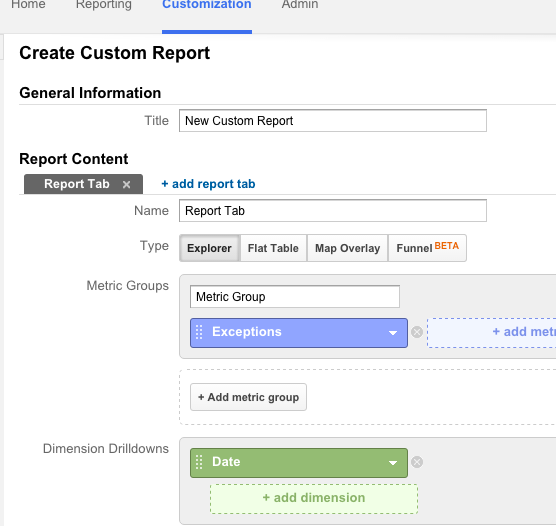
So we did that, came back in a few hours, and found a nice report on how many times someone on homepage was inconvenienced because CSS failed to load (entirely, or in time for the GTM tag to execute)
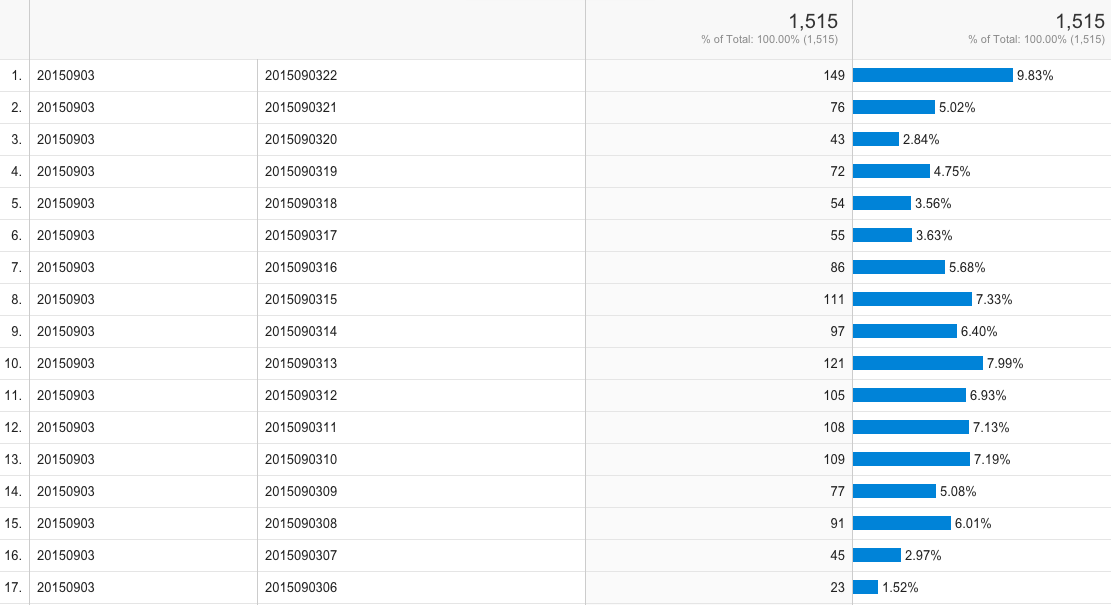
We think it was pretty cool to measure an issue with a third party, entirely using another third party (google), and not requiring a release at all. What do you think? Tell me everything, just don’t tell how stupid the title is. Its an AB test to see if stupid titles work better.
shameless plug: If this sort of work interests you, we are hiring for the Site Reliability Engineering Team @ Tokopedia. Drop me a line.