Off late, I had to revisit a node.js frontend webserver. It was written sometime back and wasn’t getting much love, but after we started autoscaling, I became increasingly concerned about its performance. Another benefit of autoscaling is that when your capacity closely mirrors traffic, you become much more aware of how much you could save if your stack was even slightly more performant.
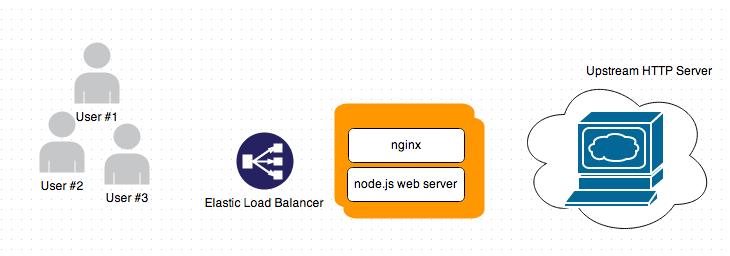
Coming back to the app - it can be thought of as an API server, written in expressjs. Each request is pre-processed, sent to an upstream server, post processed and responded to, as json. The communication between node.js frontend and upstream is over HTTP, using the request module.

The server in question runs on a small instance in EC2. With autoscaling in place, it was clear as day that improving on req/sec will reduce costs considerably, and based on these benchmarks, I knew we have a long way to go. Anyway, it seems like that time of the year when I put on the profiling hat.
To profile, I used ab as the client to drive test traffic. When profiling, I ran node.js with the –prof switch. As you can see below, I removed nginx and ELB from the picture, because neither of them were relevant to the benchmark, and replaced the upstream with a dummy server configured to send a fixed response. All of this so as to get more consistent results.

$ node --prof app

$ ab -k -n 10000 -c 128 http://example.com/most-frequent-api-request
The -k switch is important, it enables HTTP Keep Alive support, without which I got some really nasty APR errors about sockets running out. I could have avoid the -k switch by setting the “Connection: close” header on every request, which tells express to close the socket after sending response, but then I would lose the benefits of HTTP/1.1 Keep Alive. In production, our users make multiple requests and keep alive is important, so I prefered using -k over setting the header.
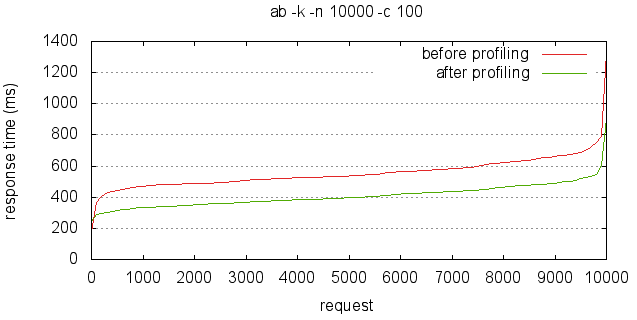
The whole excercise did throw up some surprises, and undescores how poor I really am at guessing where a computation will bog down. Before I get down to the findings, here is the impact of these changes.
Prior to the changes, the best I could get out of a small instance was 180 rps. After the changes, this became 250 tps. That’s 38% ▲ improvement, with just a few lines of code changes to app.js.

Etags
Expressjs enables etag by default. For the uninitiated, etags are a sort of response fingerprint, that can be used for better caching. Same fingerprint means the same response, so clients (aka browsers) can send the fingerprint of the last response they have, and the server can confirm if the response is still valid, saving us some bandwidth. The way express calculates etag is by running crc32 on the response.
Etags work great, and have some unexpected uses as well (tracking without cookies), but for our use case, where each response is unique and not to be cached, this was wasteful - it showed at the top in the v8 profile. More so, because we set cache-control headers to indicate that the content must not be cached, this could be considered a bug.
Resolution: Add app.disable(‘etag’) to app.js
faux HTTP method support - no thanks!
In the boilerplate template that express generates, methodOverride middleware is enabled. I never bothered about it, thinking it would be something similar to bodyParser middleware which precedes it in app.js. When it showed up in the profiler, I looked it up in connect code, to be greeted by equally obscure Provides faux HTTP method support. comment. Looking it up yielded this from stackoverflow - it basically allows you to use the right HTTP verb in forms, because HTML forms only support POST, not PUT/DELETE. Insightful, but we don’t use puts anywhere. That, and the fact that some connect versions are [vulnerable to CSS] (https://nodesecurity.io/advisories/51d0d6abf196582611000001) because the verb is not actually checked, it made sense to get rid of it. Going further on that path, I realize we don’t even use POST anywhere, and could rid ourselves of the bodyParser as well
Resolution: two lines were struck from app.js
  /* Go away, unwanted middlewares !!
  app.use(express.bodyParser());
  app.use(express.methodOverride());
  */
static before router
The order in which global middlewares are used in express matters. For example, cookie parsing must happen before request is handled. In some cases, you can change the orders, for example, whether to process static requests (static middleware) before dynamic routes (router middleware). I sometimes have this tendency to mess up with the correct configuration defaults. So while the express boilerplate code puts the static middleware after the router middleware, I once reasoned that it is stupid to go through all the configured routes for a static asset, so let’s put static first.
To say that it was a stupid idea is an understatement. 95% of the calls this webserver gets are for non-static assets, and because nginx is in the front, even those 5% static asset requests get terminated at nginx itself. Not just that, every call that went to the static middleware triggered a stat for a non existent resource. Getting the middleware order right saved hundreds of unnecessary stats per second.
Resolution: put static after router.
http.globalAgent.maxSockets
Our server generally talks to an upstream server over HTTP for most requests. At a lot of places, you will see advice for turning off socket pooling or increasing max sockets for the http agent, because as they say, only 5 sockets are opened per host, so how can you get 100s and 1000s of transactions per second if you don’t change the default. So far so good, but if there is only one host you are talking to, sometimes having a smaller maxSockets would enable connection reuse, which is good because it avoids the overhead of establishing an HTTP connection. In fact, I noticed that I got the best performance when I left the setting untinkered. However, that is not to recommend that you shouldn’t experiment with this setting - not increasing maxSockets will cause more requests to be queued, slightly increasing latency and memory requirements. In the end, I settled at a value of 25. YMMV.
Resolution: set global maxSockets to 25
http.globalAgent.maxSockets = 25;url safe base64
Now this is something that doesn’t relate to the theme of this post, because it wasn’t the profiler that showed me this, but as it was a surprise, I am adding it to this post.
We use base64 for encoding some binary data as url components. Base64 is a radix 64 encoding used extensively in data URIs, email attachments, and what not (if you remember the good old days when we ran uuencode). In node.js, the way to get base64 encoding/decoding done on strings is to use Buffer.
var encoded = new Buffer('hello world').toString('base64');
var decoded = new Buffer(encoded,'base64').toString();
When base64 strings are used as URI Components, a modified version of the base64 called urlsafe base64 is used. That’s because the original character set, buses ‘+’ and ‘/’ in addition to 26 upper case and 26 lower case letters, and 10 digits to get the count to 64, and + and / are not deemed urlsafe. People recommend doing a .replace(‘+’,’-‘).replace(‘/’,’.’) on a base64 string to get the urlsafe version, and vice versa to convert a urlsafe string to a regular base64, which can then be decoded. It turns out that the first part is true (but not the fastest), and the second part is redundant. node.js buffers handle urlsafe base64 strings just as well, with and without padding. Now this didn’t show up in profiling, but I added it here anyway. Here’s the revealing comment from src/string_bytes.cc
// supports regular and URL-safe base64
I guess its not documented because its only supported for decoding, not while encoding.
All in all, its good to know what’s happening under the hood, and I should hang out with the profiler more often.
Related
- Real Time Dashboard using GA and dashing
- 10 steps to nodejs nirvana in production
- pstack for node.js
- Profiling node apps
- A Magento Api client in nodejs